As fiscal year 2010 draws to a close and the economy struggles to recover from the deepest recession since the Great Depression, the federal government faces a number of fiscal challenges. The budget deficit is projected to exceed $1.4 trillion due in part to increased spending on fiscal stimulus programs and a sharp reduction in tax revenues due to the recession. But underlying the current fiscal situation is a structural deficit that the economic downturn only exacerbated. As Congress and the administration focus more attention on reducing the deficit, all areas of the budget, including defense, have come under increased scrutiny.
The Obama Administration’s FY 2011 budget request includes a total of $712 billion for the Department of Defense (DoD). The base budget for the Department includes $549 billion in discretionary funding and $4 billion in mandatory funding. An additional $159 billion is requested for the wars in Afghanistan and Iraq. The budget also requests $19 billion for defense-related atomic energy programs, $8 billion for defense-related activities in other agencies, and $122 billion for veterans. Together these expenses total $861 billion, or 22 percent of the total federal budget.
The defense budget, in many respects, is a microcosm of the rest of the federal budget, and the challenges facing DoD in pay, pensions, health care, infrastructure, contracting, and education, to name a few, are also issues in other areas of the budget. My testimony provides an overview of trends and issues in the defense budget and their potential impact on future defense spending and capabilities. I begin by providing an overview of defense spending from an historical perspective and explaining how the share of the defense budget devoted to acquisition and operations and support has varied over time. I then explore in more detail trends in military personnel costs, acquisition costs, classified funding, and war funding. While the issues I identify are not new, what makes these issues of more concern now is that in a constrained budget environment we no longer have the luxury of simply spending our way out of difficult decisions
The total national defense budget request for FY 2011, adjusted for inflation,is at the highest dollar amount since World War II and is higher than total defense spending at any point in the Vietnam or Korean Wars, even if the cost of the wars in Iraq and Afghanistan are excluded. However, defense spending as a percent of GDP is 4.8 percent in the FY 2011 budget request, below the post-World War II average of 6.5 percent. The apparent discrepancy between defense spending being at a peak level in inflation-adjusted dollars but not as percent of GDP is due to the different rates of growth in the defense budget and national economic output. From the previous peak in defense spending in FY 1985 to the FY 2011 budget request, defense spending grew by 37 percent in real terms compared to 102 percent real growth in GDP over the same period. As a result, the total defense budget as a percent of GDP has fallen from 7.1 to 4.8 percent over that time period because the denominator (GDP) has grown much faster than the numerator (defense spending).
Looking at the defense spending over time, two trends become apparent. The first is that defense spending rises and falls in irregular cycles, which are primarily driven by external events. In the early 1950s, the budget increased sharply for the Korean War. During the Vietnam War, defense spending steadily increased for six years before it peaked in FY 1968 and then declined for the next seven years. The Cold War buildup of the 1980s saw the budget increase for six years until it peaked in FY 1985 and declined for the next ten years. The current cycle, however, is different in several respects: the budget may not have peaked yet, depending on how the war in Afghanistan progresses; and the global economic outlook and federal deficit are worse than in previous cycles. Moreover, the current buildup in defense spending has been a “hollow” buildup in many respects because the military’s end strength has remained nearly constant at 1.5 million in the active force, and the equipment inventory has gotten smaller and older in many areas.
The second notable trend is that after each cycle the budget returns to a floor,and that floor is gradually rising over time. At the end of WWII, defense spending plummeted to less than $100 billion in today’s dollars. After the Korean War, the defense budget dropped again, but only to about $290 billion, this time due, in part, to the emergence of a peacetime defense industry. Following the Vietnam War, defense spending fell again to about $300 billion. After the end of the Cold War buildup, the defense budget never dropped below $350 billion. These two trends suggest that if the current cycle were to follow the same pattern—and there are reasons to think it may not—the defense budget could experience a significant decline over the coming decade. While such cycles are understandable given the ever-changing threat environment the nation faces, sharp rises and declines in the defense budget complicate long-term defense planning.
Just as the topline of the defense budget has varied over time, the way in which money is allocated within the defense budget has also varied. In recent years, funding has shifted away from acquisition accounts toward operation and maintenance and military personnel accounts. At the previous peak in defense spending in FY 1985, the operations and maintenance and military personnel accounts garnered 51 percent of the total DoD budget versus 45 percent for acquisition. In the FY 2011 budget request, 67 percent is allocated for operations and maintenance and military personnel, compared to 30 percent for acquisition—or 62 percent and 34 percent, respectively, if war funding is excluded.
The rapid growth in personnel costs is of particular concern because the total number of personnel has not varied significantly over the past decade. Since 2001, the military personnel budget has grown by a total of 46 percent, adjusting for inflation and not including war funding, to $139 billion in the FY 2011 request. What is not included in that figure is the Defense Health Program, which is funded under the operations and maintenance title of the budget at $30 billion. Also not included is the cost of DoD civilian personnel, which adds another $77 billion. In total, DoD spends some $246 billion on uniformed military and DoD civilian personnel—not including the cost of contractors. With a payroll of 2.3 million direct employees, DoD makes up 51 percent of the federal workforce and employs more Americans than Wal-Mart and the U.S. Postal Service combined.
A notable trend in military personnel funding is the growing portion of military compensation that is consumed by noncash and deferred benefits. For comparison, in the private sector about 29 percent of total compensation costs go to non-cash and deferred benefits,such as healthcare and pensions. At General Motors, before it went into bankruptcy, noncash and deferred compensation made up 45 percent of total compensation costs. For DoD, the figure is 52 percent. Military healthcare is a major contributor to noncash and deferred compensation costs for DoD, due in part to more and more military retirees and their dependents electing to use their military healthcare benefit. A total of 9.5 million Americans are now eligible beneficiaries in the military healthcare system, including the active-duty military, military retirees, and their dependents, at a cost to DoD of $50.7 billion in the FY 2011 budget request.
The fee charged to military retirees for enrollment in TRICARE was set in 1995 at $460 for a family plan and has not increased since then. For comparison, the average annual premium paid by private-sector workers is $3500—not including the share of annual premiums paid by their employers. About 70 percent of military retirees have access to private-sector insurance, but because of this growing price differential more of them are choosing to stay in the military system. Another factor in the rising cost of military healthcare is the TRICARE for Life program, a Medicare supplemental insurance program for military retirees over the age of 65 that was enacted in 2001. Accrual payments to this trust fund now total $11 billion annually.
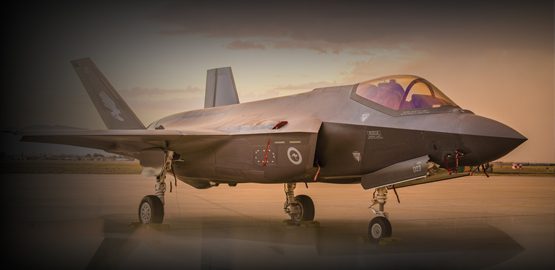
But personnel-related costs are not the only area of the defense budget that has grown over the past decade. The budget for acquisitions, including research, development, test, and evaluation (RDT&E) and procurement, has also grown by a total of 46 percent since FY 2001, adjusting for inflation and not including war funding. A notable trend within the acquisition budget is the relatively high level of funding allocated to RDT&E for the development of new weapon systems. Over time, this has undermined DoD’s ability to substantially fund for the procurement of new weapon systems and correct the lagging pace of procurements from the past two decades. The ratio of procurement to RDT&E has fallen from a peak of 3.5 to 1 during the early 1980s to its current level of 1.5 to 1 in the base budget request for FY 2011. What this trend indicates is that DoD continues to spend a greater share of its acquisition budget to develop new and sophisticated weapon systems but does not adequately fund the procurement of these systems in quantity. However, the future-year defense program submitted with the FY 2011 budget request begins to reverse this trend. Funding for procurement is projected to rise and RDT&E is projected to decline over the coming years. By FY 2015 the ratio of procurement to RDT&E in the base budget will reach 2.0 to 1, the highest level since FY 1990.
Classified funding in the DoD budget has also been growing at a rapid pace. Total classified funding, including both base and war funding, is some $57.8 billion in the FY 2011 request. Adjusting for inflation,this is the highest level seen since CSBA began tracking it in FY 1987. Classified O&M funding has not been consistently reported in previous years, but this year’s budget request reveals that it is the fastest-growing area within classified funding. Classified O&M increases 9.6 percent in real terms in the FY 2011 request over the previous year, which follows a similar 11.0 percent real increase in FY 2010.
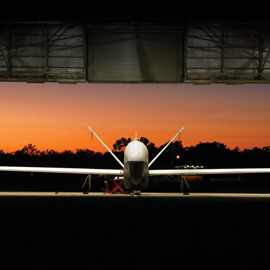
The Air Force receives the largest share of DoD’s classified acquisition funding—nearly 80 percent of the total. Classified programs account for about 43 percent, or $19.1 billion, of the Air Force’s procurement request and 46 percent, or $12.6 billion, of its RDT&E request. The concentration of classified funding in the Air Force’s budget is the result of two factors. First, the Air Force acquisition budget is believed to contribute funds to a number of intelligence agencies, including the Central Intelligence Agency (CIA), National Security Agency (NSA), and National Reconnaissance Office(NRO). Second, the Air Force is responsible for most command, control, communications, and intelligence (C3I) functions and related assets such as reconnaissance satellites and satellite launch and control facilities, which tend to be heavily classified programs.
The record for classified acquisition programs is mixed. A notable success was the Corona program for reconnaissance satellites, which produced valuable imagery intelligence from 1960 to 1972. Several successful and effective aircraft have also been developed and even produced as black programs, including the F-117 stealth fighter,the B-2 stealth bomber, and the SR-71 reconnaissance plane. Some classified programs have had troubled histories, such as the National Reconnaissance Office’s Future Imagery Architecture program to develop the next generation of spy satellites, which was canceled in 2005 due to significant cost overruns and technical issues at a reported $4 billion loss for the government. However, it should be noted that the mere existence of classified programs can create uncertainty in the minds of potential adversaries. Such uncertainly complicates their planning and, potentially, compels them to divert resources to hedge against an unknown capability. Classified programs can therefore be part of a cost-imposing strategy on potential adversaries.
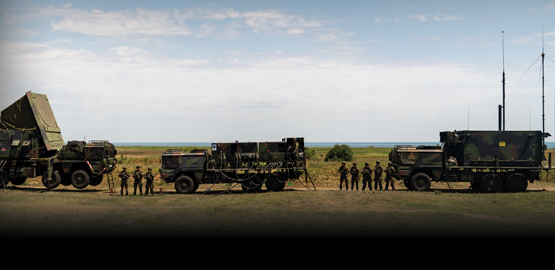
Funding for the wars in Afghanistan and Iraq totals $159.3 billion in the FY 2011 request. The budget request continues the trend of declining funding for Iraq, as troops levels there subside, and increasing funding for Afghanistan. The budget request does not include a projection for war costs in future years. Instead, it includes “allowances” of $50 billion per year for FY 2012 to FY 2015, the same amount that was used in the FY 2010 budget request as a placeholder for future war funding.
The future cost of the wars depends on a number of external factors that cannot be known in advance, such as operational tempo, fuel prices, and the number and composition of forces deployed in future years. While the cost of each conflict depends on many variables, previous analysis by CSBA has demonstrated a strong correlation between the number of troops deployed and the total annual cost. Based on the most current information on troop levels and costs, the annual cost per troop since FY 2005 has averaged $1.2 million in Afghanistan and $0.69 million in Iraq, in constant-year FY 2011 dollars.
The trends in the defense budget outlined here, particularly growth in military personnel costs and the historically low ratio of procurement to RDT&E funding, are cause for concern. If these trends are not reversed, it will not be possible for the Department to maintain its current force structure and capabilities without significant increases in funding above the current level. Secretary Gates has made preserving the force structure a top priority, and as part of his efficiencies initiative has directed the Department to find savings in other parts of the budget that could be directed to force structure and acquisitions. However, efficiencies alone are not likely to result in the magnitude of savings required.
The largest source of savings proposed is to reduce spending on support contractors by 30 percent over the next three years. According to Congressional Research Service estimates, this could generate savings of $3.6 billion annually once it is fully implemented. Smaller cuts include the elimination of Networks and Information Integration (NII), J6, Business Transformation Agency (BTA), and Joint Forces Command (JFCOM). While these eliminations appear to be justified,the total savings achieved will depend greatly on how they are implemented. If these organizations are eliminated without corresponding reductions in the headcount of military personnel, DoD civilians, and support contractors, the savings will be limited. The initiatives announced by the Department so far are a step in the right direction, but they do not address some of the fundamental issues that plague the defense budget, such as the rising cost of military healthcare.
To its credit, the Department has made specific,targeted cuts to programs and activities it has deemed to be a lower priority. This is a sound approach, and if applied to the rest of the defense budget it is one that will ultimately make the military more efficient and effective in the long run. The alternative is to simply spread the cuts around evenly throughout the Department. The risk with this approach is that it does not prioritize programs and activities within the budget and could result in a military that looks and operates much like the one we have today, but is smaller and less capable.
The challenge for policy makers in such a constrained budget environment is to adequately fund for the support and modernization of our national defense capabilities without spending one dollar more than is necessary. Rooting out waste, inefficiency,and low-priority activities within the defense budget is a difficult and delicate task. In some cases, it will mean lost jobs. In other cases, it will require taking on vested interests both within the Pentagon and outside the building. While the prospect of a flat or declining defense budget may seem like a daunting challenge, particularly while the nation is still engaged in two ongoing wars and unemployment is over 9 percent, it should also be viewed as an opportunity. It can provide both the fiscal and political imperative to jettison programs and activities that are no longer needed—budget artifacts from a bygone era—and focus more effectively on the capabilities needed to deter, fight, and win wars in the future


